How to Remote Debug a Containerized Java Application with IntelliJ IDEA

Recently, while creating an application for my Medium articles, I stumbled upon a very time-consuming problem. My local environment was working perfectly fine, but when I containerized my Java application and ran it, I encountered an authentication error. I think many developers encountered this situation; don’t you agree it’s overwhelming ?
This was particularly challenging because I couldn’t recreate the issue during local debugging sessions. Adding random loggers to trace the mistake wasn’t feasible since my API was returning a 401 error, and the service wasn’t being called at all. At this point, I realized I needed a different approach rather than adding random loggers or attempting fixes and rebuilding the Docker image repeatedly — which is very time-consuming, especially with large images. Rebuilding the Docker image each time felt like watching paint dry — it was that slow!
My first thought was: Can I debug a running Java container? This question led me to discover the remote debugging capabilities of IntelliJ IDEA.
Getting Started
First, after creating the application that you need to debug remotely, open the Edit Configurations menu in IntelliJ IDEA. Click the ‘+’ icon and select Remote JVM Debug.
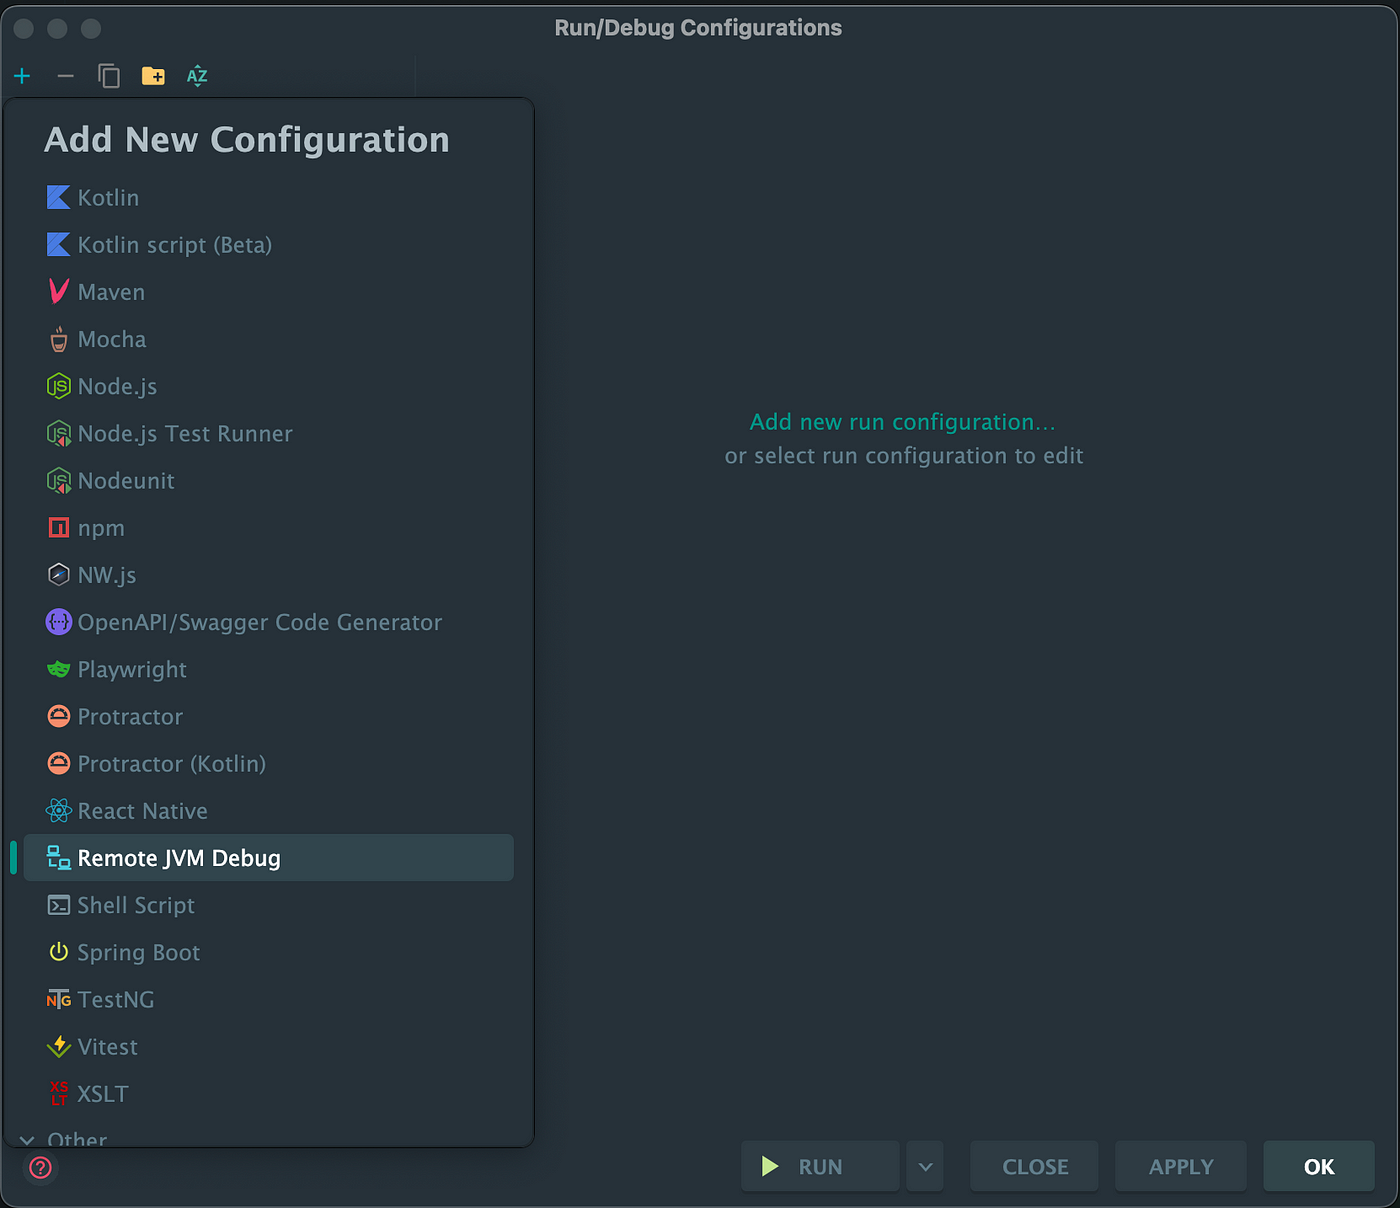
After selecting Remote JVM Debug you will see a screen like that:
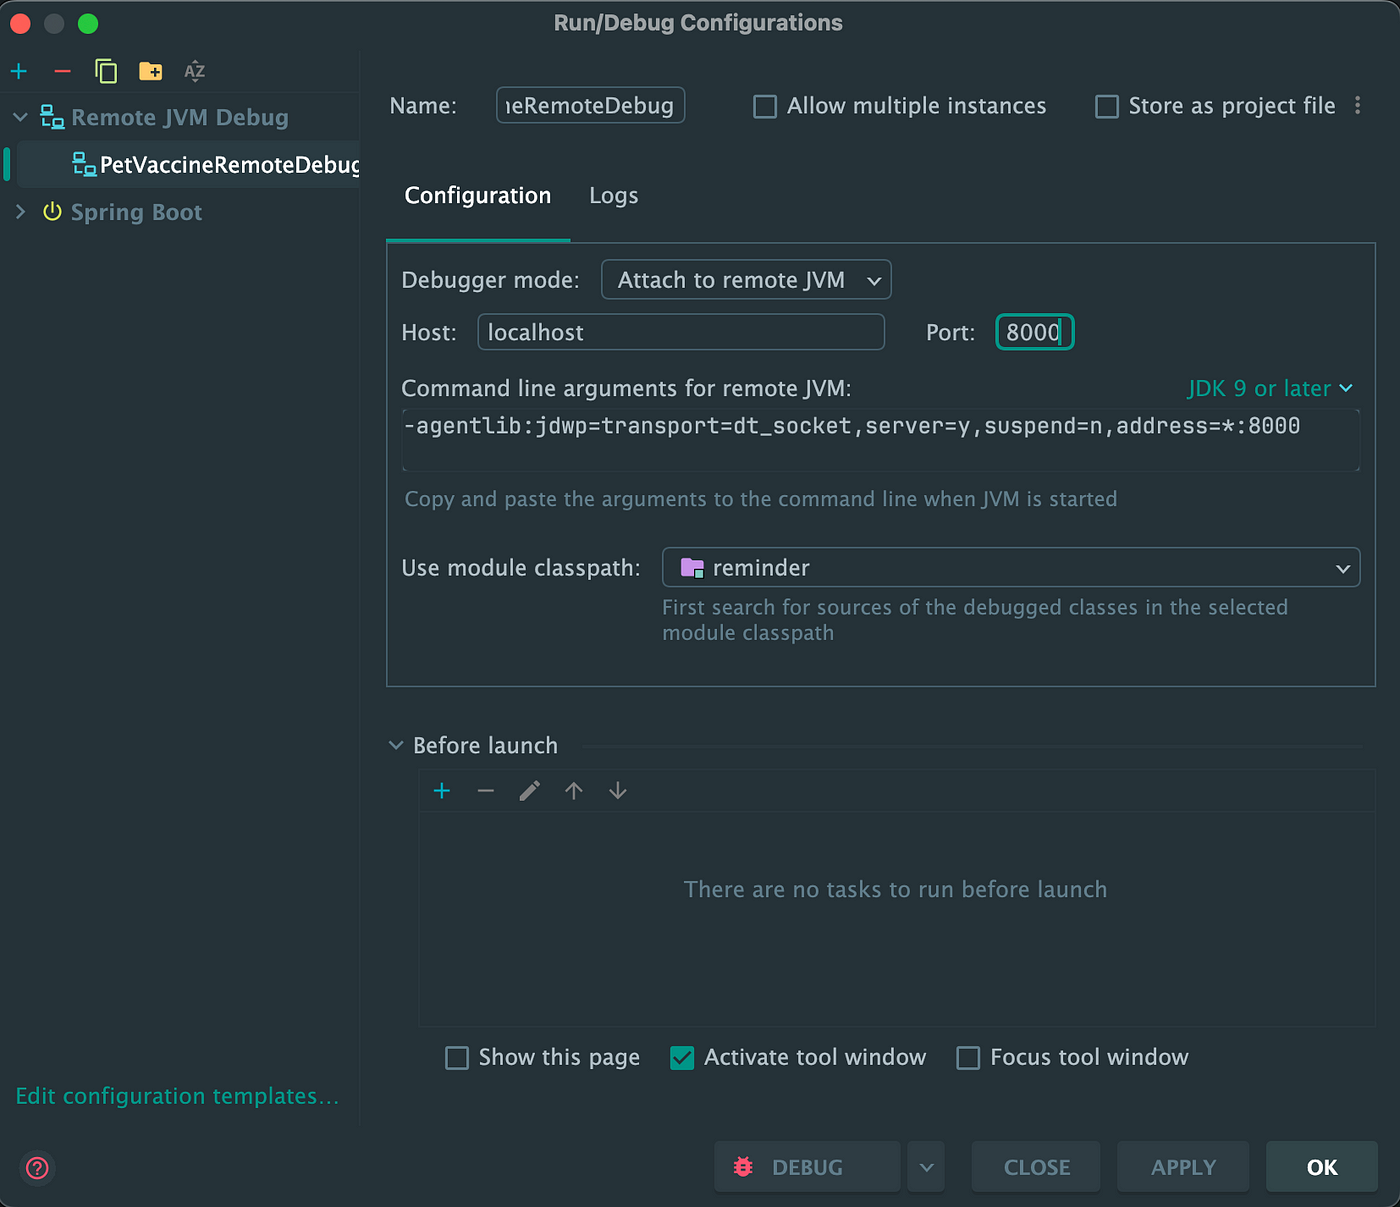
In the configuration screen, adjust the settings according to your needs:
- Name: Meaningful name to your debugger configuration.
- Port: A port for your debugger. Note that this port should not be the same as your application port. You need to expose two different ports one for the application and another one for the debugger.
- JDK Version: Choose the correct JDK version that matches your application. The auto generated command line arguments for the remote JVM will change depending on the JDK version.
After selecting the correct settings for your application, you can copy the generated command line arguments.
Creating the Dockerfile
Next, we will create a Dockerfile using the command line arguments from the previous step. Here is the Dockerfile I generated for my application:
FROM maven:3.9.9 AS maven
LABEL authors="Muratcan Yeldan"

WORKDIR /opt/reminder
COPY . /opt/reminder
RUN mvn clean install

FROM eclipse-temurin:21-jre-alpine

ARG JAR_FILE=PetVaccineReminder.jar

WORKDIR /opt/reminder

COPY --from=maven /opt/reminder/target/${JAR_FILE} /opt/reminder/

ENTRYPOINT ["java","-agentlib:jdwp=transport=dt_socket,server=y,suspend=n,address=*:8000","-jar","PetVaccineReminder.jar"]
In the given ENTRYPOINT, the auto-generated command line arguments are added after the java command. Ensure that you add the command line arguments before the -jar command; otherwise, the remote debugger cannot be attached.
Setting Up docker-compose.yml
After creating the Dockerfile, you can build and run the image directly or create a docker-compose.yml for your project. Here is an example docker-compose.yml:
services:
  reminder_service:
    build:
      dockerfile: Dockerfile
    container_name: reminder_service
    restart: on-failure
    ports:
      - "8085:8085"
      - "8000:8000"
    environment:
      SPRING_PROFILES_ACTIVE: docker
    depends_on:
      postgres-app:
        condition: service_healthy
      kafka:
        condition: service_healthy
    networks:
      - backend-network

networks:
  backend-network:
    driver: bridge
The key point to notice here is that we should expose both our application port (8085 in this case) and the debugger port ( 8000 in this case). After running our docker-compose.yml, we can continue to run the remote debug configuration we created earlier.
Starting the Debugger

After clicking the Debug button in IntelliJ IDEA, you should see a log in the console indicating that the debugger has connected to the specified port.

From here, you can continue debugging your application just as you would on your local machine.
You can find my example project here. It includes various technologies like Kafka and Keycloak. Stay tuned for upcoming articles.
Thank you for reading, and happy coding!